Frühlingsrabtatt -> 10% Rabatt! Code: "SPRING"
Dodge & Cox

Dodge & Cox Portfolio: Aktien und Depot im Überblick
Laut dem letzten 13F-Filing (Stand 30.06.2026) umfasst das Depot von Dodge & Cox 222 Positionen mit einem Gesamtwert von $191,0 Mrd.
Wertentwicklung1 Jahr+17,24 %3 Jahre+78,84 %5 Jahre+91,87 %
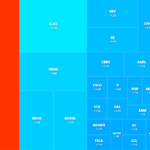
Die größten Positionen im Depot sind Johnson Ctls International (JCI, 4,3 %), Schwab Charles (SCHW, 3,7 %) und Rtx (RTX, 3,5 %). Zusammen machen sie 11,5 % des Depots aus.
Was hat Dodge & Cox im 2. Quartal 2026 gekauft und verkauft?
Laut 13F-Meldung hat Dodge & Cox im 2. Quartal 2026 9 Positionen neu gekauft, 71 aufgestockt, 92 reduziert und 9 komplett verkauft.
Größte Käufe
- Booking HoldingsBKNGaufgestockt um 2.460,1 %≈ $4,4 Mrd.
- VisaVaufgestockt um 630.554,9 %≈ $1,9 Mrd.
- Thermo Fisher ScientificTMOaufgestockt um 11.767,4 %≈ $1,5 Mrd.
Größte Verkäufe
- Lyondellbasell IndustriesLYBkomplett verkauft≈ $1,4 Mrd.
- Goldman Sachs GroupGSreduziert um 90,3 %≈ $1,3 Mrd.
- Norfolk SouthnNSCreduziert um 59,9 %≈ $1,2 Mrd.
Prozentangaben: Veränderung der Stückzahl der jeweiligen Position gegenüber dem Vorquartal (kein Kursgewinn). Dollarwerte geschätzt mit dem Kurs zum Quartalsende. Sortiert nach Wert.

Dodge & Cox
Echtzeit-Einblicke & Depot-Analyse
Gesamtwert (USD) $191,0 Mrd.
Größte Position Johnson Ctls Intl Plc
Letztes Update Q2 2026
Gesamtrendite · 1 Jahr +17,24 %
Gesamtrendite · 3 Jahre +78,84 %
Gesamtrendite · 5 Jahre +91,87 %
222 Positionen
| Aktie | % Depot | Market Value $ | Shares | Q2 vs. Q1 2026 | Last Transaction | Kurs | |
|---|---|---|---|---|---|---|---|
 JCIJohnson Ctls Intl Plc | 4,27% | $8.149.432.237 | 55.776.006 | SOLD Q2 · 2026-3,0% · 1,7 Mio. Stk. | ← | $155,93 | |
 SCHWSchwab Charles Corp | 3,72% | $7.101.867.203 | 76.968.323 | BUY Q2 · 2026+2,6% · 2,0 Mio. Stk. | ← | $95,58 | |
 RTXRtx Corporation | 3,49% | $6.662.036.733 | 35.113.249 | SOLD Q2 · 2026-1,0% · 360 Tsd. Stk. | ← | $180,26 | |
 CVSCvs Health Corp | 2,71% | $5.173.820.539 | 50.012.765 | SOLD Q2 · 2026-3,4% · 1,8 Mio. Stk. | ← | $87,95 | |
 MSFTMicrosoft Corp | 2,51% | $4.788.170.142 | 12.836.229 | BUY Q2 · 2026+7,3% · 876 Tsd. Stk. | ← | $529,76 | |
 BKNGBooking Holdings Inc | 2,38% | $4.551.705.968 | 25.536.950 | BUY Q2 · 2026+2.460,1% · 24,5 Mio. Stk. | ← | $155,87 | |
 HUMHumana Inc | 2,28% | $4.345.737.744 | 10.940.380 | SOLD Q2 · 2026-3,9% · 440 Tsd. Stk. | ← | $396,51 | |
 GOOGAlphabet Inc | 2,21% | $4.226.214.403 | 11.961.097 | SOLD Q2 · 2026-2,2% · 267 Tsd. Stk. | ← | $347,37 | |
 METMetlife Inc | 2,15% | $4.097.759.602 | 48.431.150 | SOLD Q2 · 2026-5,3% · 2,7 Mio. Stk. | ← | $95,78 | |
N/A SUNBSunbelt Rentals Holdings Inc | 2,14% | $4.096.716.044 | 54.761.610 | BUY Q2 · 2026+3,1% · 1,7 Mio. Stk. | ← | $74,77 | |
 AMZNAmazon Com Inc | 2,08% | $3.982.306.988 | 16.708.513 | BUY Q2 · 2026+10,6% · 1,6 Mio. Stk. | ← | $259,92 | |
 GOOGLAlphabet Inc | 1,99% | $3.809.156.798 | 10.658.860 | BUY Q2 · 2026+0,3% · 34 Tsd. Stk. | ← | $350,50 | |
 UNHUnitedhealth Group Inc | 1,97% | $3.770.702.593 | 9.072.258 | SOLD Q2 · 2026-4,2% · 394 Tsd. Stk. | ← | $375,98 | |
 METAMeta Platforms Inc | 1,91% | $3.655.332.449 | 6.489.255 | BUY Q2 · 2026+29,4% · 1,5 Mio. Stk. | ← | $721,31 | |
 OXYOccidental Pete Corp | 1,85% | $3.534.193.330 | 72.764.944 | SOLD Q2 · 2026-1,8% · 1,3 Mio. Stk. | ← | $58,21 | |
 TELTe Connectivity Plc | 1,79% | $3.421.097.106 | 16.968.886 | BUY Q2 · 2026+15,5% · 2,3 Mio. Stk. | ← | $215,83 | |
 CIThe Cigna Group | 1,76% | $3.356.093.871 | 12.173.875 | BUY Q2 · 2026+5,3% · 618 Tsd. Stk. | ← | $278,51 | |
 REGNRegeneron Pharmaceuticals | 1,59% | $3.037.348.765 | 4.871.137 | BUY Q2 · 2026+9,3% · 413 Tsd. Stk. | ← | $742,12 | |
 GILDGilead Sciences Inc | 1,57% | $2.991.423.815 | 23.677.567 | SOLD Q2 · 2026-2,4% · 573 Tsd. Stk. | ← | $146,85 | |
 IFFInternational Flavors&Fragra | 1,53% | $2.931.697.471 | 37.007.037 | BUY Q2 · 2026+1,5% · 534 Tsd. Stk. | ← | $84,11 | |
 AONAon Plc | 1,49% | $2.850.259.933 | 8.593.144 | BUY Q2 · 2026+5,9% · 477 Tsd. Stk. | ← | $270,47 | |
 CMCSAComcast Corp New | 1,49% | $2.845.421.719 | 115.903.125 | BUY Q2 · 2026+2,5% · 2,8 Mio. Stk. | ← | $20,94 | |
 APDAir Prods & Chems Inc | 1,44% | $2.753.984.278 | 9.393.493 | BUY Q2 · 2026+1,8% · 162 Tsd. Stk. | ← | $278,12 | |
 FTVFortive Corp | 1,41% | $2.686.724.271 | 43.979.772 | BUY Q2 · 2026+1,9% · 824 Tsd. Stk. | ← | $56,52 | |
N/A BNBrookfield Corp | 1,36% | $2.606.961.626 | 61.210.651 | BUY Q2 · 2026+3,4% · 2,0 Mio. Stk. | ← | $36,98 | |
 WFCWells Fargo & Co New | 1,36% | $2.588.952.219 | 31.328.076 | BUY Q2 · 2026+0,5% · 160 Tsd. Stk. | ← | $80,26 | |
 GSKGsk Plc | 1,32% | $2.526.513.684 | 48.197.514 | SOLD Q2 · 2026-17,8% · 10,5 Mio. Stk. | ← | $47,02 | |
 FISVFiserv Inc | 1,29% | $2.462.062.101 | 50.194.946 | SOLD Q2 · 2026-0,1% · 66 Tsd. Stk. | ← | $45,31 | |
 BUDAnheuser Busch Inbev Sa Nv | 1,27% | $2.428.933.475 | 29.477.348 | SOLD Q2 · 2026-0,7% · 206 Tsd. Stk. | ← | $74,62 | |
 GEHCGe Healthcare Technologies I | 1,27% | $2.423.685.138 | 37.864.164 | BUY Q2 · 2026+20,9% · 6,6 Mio. Stk. | ← | $64,67 | |
 BNYBank Of New York Mellon Corp | 1,26% | $2.401.736.386 | 16.608.370 | SOLD Q2 · 2026-29,0% · 6,8 Mio. Stk. | ← | $142,72 | |
 ROPRoper Technologies Inc | 1,25% | $2.389.230.681 | 7.060.583 | BUY Q2 · 2026+111,2% · 3,7 Mio. Stk. | ← | $358,57 | |
 FDXFedex Corp | 1,19% | $2.264.953.408 | 7.233.269 | SOLD Q2 · 2026-27,5% · 2,8 Mio. Stk. | ← | $289,04 | |
 SBACSba Communications Corp | 1,14% | $2.174.561.401 | 12.323.254 | BUY Q2 · 2026+2,0% · 243 Tsd. Stk. | ← | $170,38 | |
 AJGGallagher Arthur J & Co | 1,13% | $2.149.609.457 | 9.363.634 | BUY Q2 · 2026+27,3% · 2,0 Mio. Stk. | ← | $227,10 | |
 CHTRCharter Communications Inc N | 1,12% | $2.137.731.153 | 15.032.214 | BUY Q2 · 2026+2,8% · 405 Tsd. Stk. | ← | $106,96 | |
N/A WTWWillis Towers Watson Plc Ltd | 1,10% | $2.097.596.707 | 8.025.392 | BUY Q2 · 2026+9,5% · 693 Tsd. Stk. | ← | $290,67 | |
 ZBHZimmer Biomet Holdings Inc | 1,09% | $2.076.898.436 | 24.124.735 | BUY Q2 · 2026+2,5% · 582 Tsd. Stk. | ← | $88,49 | |
 CARRCarrier Global Corporation | 1,06% | $2.015.335.480 | 27.475.603 | BUY Q2 · 2026+3,2% · 853 Tsd. Stk. | ← | $55,00 | |
 BKRBaker Hughes Company | 1,01% | $1.934.423.751 | 34.854.482 | SOLD Q2 · 2026-2,8% · 1,0 Mio. Stk. | ← | $55,41 | |
 FISFidelity Natl Information Sv | 1,00% | $1.907.805.830 | 49.069.080 | SOLD Q2 · 20260,0% · 4 Tsd. Stk. | ← | $33,82 | |
 VVisa Inc | 0,97% | $1.858.630.377 | 5.417.326 | BUY Q2 · 2026+630.554,9% · 5,4 Mio. Stk. | ← | $372,10 | |
 COFCapital One Finl Corp | 0,96% | $1.829.238.314 | 9.117.926 | BUY Q2 · 2026+3,9% · 343 Tsd. Stk. | ← | $195,91 | |
N/A TRUTransunion | 0,91% | $1.745.514.662 | 24.196.211 | BUY Q2 · 2026+49,5% · 8,0 Mio. Stk. | ← | $62,82 | |
 ELANElanco Animal Health Inc | 0,87% | $1.658.640.785 | 67.397.025 | SOLD Q2 · 2026-2,2% · 1,5 Mio. Stk. | ← | $22,36 | |
 UBSUbs Group Ag | 0,87% | $1.666.001.775 | 33.630.342 | SOLD Q2 · 20260,0% · 14 Tsd. Stk. | ← | $47,42 | |
 TMOThermo Fisher Scientific Inc | 0,80% | $1.531.543.498 | 3.054.778 | BUY Q2 · 2026+11.767,4% · 3,0 Mio. Stk. | ← | $662,06 | |
 HLNHaleon Plc | 0,73% | $1.398.888.950 | 149.934.507 | BUY Q2 · 2026+2,3% · 3,4 Mio. Stk. | ← | $9,02 | |
 INCYIncyte Corp | 0,71% | $1.355.482.475 | 11.957.326 | SOLD Q2 · 2026-2,4% · 295 Tsd. Stk. | ← | $113,44 | |
 SUSuncor Energy Inc New | 0,71% | $1.361.676.619 | 25.366.554 | SOLD Q2 · 2026-3,4% · 896 Tsd. Stk. | ← | $68,14 |
Seite 1 von 5Nächste »