Frühlingsrabtatt -> 10% Rabatt! Code: "SPRING"
Duan Yongping

Duan Yongping Portfolio: Das H&H International Investment Depot im Überblick
Laut dem letzten 13F-Filing (Stand 30.06.2026) umfasst das H&H International Investment Depot von Duan Yongping 18 Positionen mit einem Gesamtwert von $19,1 Mrd.
Wertentwicklung1 Jahr+25,40 %3 Jahre+56,35 %5 Jahre+98,39 %
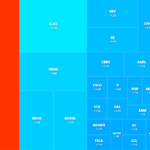
Die größten Positionen im H&H International Investment Depot sind Apple (AAPL, 41,1 %), Berkshire Hathaway Inc Del (BRK-B, 24,2 %) und Pdd Holdings (PDD, 10,0 %). Zusammen machen sie 75,2 % des Depots aus.
Was hat Duan Yongping im 2. Quartal 2026 gekauft und verkauft?
Laut 13F-Meldung hat Duan Yongping im 2. Quartal 2026 1 Position neu gekauft, 3 aufgestockt, 7 reduziert und 2 komplett verkauft.
Größte Käufe
- Pdd HoldingsPDDaufgestockt um 26,7 %≈ $402 Mio.
- Berkshire Hathaway Inc DelBRK-Baufgestockt um 0,9 %≈ $41 Mio.
- Alibaba Group HoldingBABAneu gekauft≈ $29 Mio.
Prozentangaben: Veränderung der Stückzahl der jeweiligen Position gegenüber dem Vorquartal (kein Kursgewinn). Dollarwerte geschätzt mit dem Kurs zum Quartalsende. Sortiert nach Wert.

Duan Yongping
H&H International Investment, LLC
Echtzeit-Einblicke & Depot-Analyse
Gesamtwert (USD) $19,1 Mrd.
Größte Position Apple Inc
Letztes Update Q2 2026
Gesamtrendite · 1 Jahr +25,40 %
Gesamtrendite · 3 Jahre +56,35 %
Gesamtrendite · 5 Jahre +98,39 %
18 Positionen
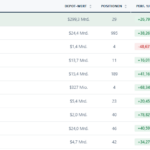
| Aktie | % Depot | Market Value $ | Shares | Q2 vs. Q1 2026 | Last Transaction | Kurs | |
|---|---|---|---|---|---|---|---|
 AAPLApple Inc | 41,05% | $7.841.281.858 | 27.098.707 | SOLD Q2 · 2026-6,4% · 1,8 Mio. Stk. | ← | $342,37 | |
 BRK-BBerkshire Hathaway Inc Del | 24,18% | $4.618.447.581 | 9.229.696 | BUY Q2 · 2026+0,9% · 82 Tsd. Stk. | ← | $570,89 | |
 PDDPdd Holdings Inc | 9,99% | $1.908.685.330 | 25.022.094 | BUY Q2 · 2026+26,7% · 5,3 Mio. Stk. | ← | $83,03 | |
 TSLATesla Inc | 7,44% | $1.421.796.240 | 3.380.400 | SOLD Q2 · 2026-0,8% · 29 Tsd. Stk. | ← | $358,22 | |
 NVDANvidia Corporation | 6,58% | $1.256.700.261 | 6.280.675 | SOLD Q2 · 2026-54,6% · 7,6 Mio. Stk. | ← | $186,64 | |
 GOOGAlphabet Inc | 3,64% | $695.565.438 | 1.968.600 | SOLD Q2 · 2026-46,9% · 1,7 Mio. Stk. | ← | $283,93 | |
 OXYOccidental Pete Corp | 2,61% | $498.401.055 | 10.261.500 | – | SOLD Q1 · 2026-22,1% · 2,9 Mio. Stk. | $56,38 | |
 MSFTMicrosoft Corp | 1,47% | $281.294.382 | 754.100 | SOLD Q2 · 2026-25,8% · 262 Tsd. Stk. | ← | $530,61 | |
 CRDOCredo Technology Group Holdi | 1,00% | $190.691.340 | 701.200 | SOLD Q2 · 2026-6,7% · 50 Tsd. Stk. | ← | $120,51 | |
 UNHUnitedhealth Group Inc | 0,87% | $166.085.748 | 399.600 | SOLD Q2 · 2026-33,6% · 202 Tsd. Stk. | ← | $394,15 | |
 DISDisney Walt Co | 0,86% | $164.260.250 | 1.706.600 | BUY Q2 · 2026+12,9% · 195 Tsd. Stk. | ← | $116,75 | |
 BABAAlibaba Group Hldg Ltd | 0,15% | $28.928.372 | 301.400 | NEW Q2 · 2026301 Tsd. Stk. | ← | $109,45 | |
N/A CRCLCircle Internet Group Inc | 0,07% | $12.526.000 | 200.000 | – | – | $67,88 | |
 PLTRPalantir Technologies Inc | 0,04% | $7.000.200 | 60.000 | – | – | $160,38 | |
 SNPSSynopsys Inc | 0,02% | $4.460.700 | 10.000 | – | – | $450,46 | |
 SNOWSnowflake Inc | 0,01% | $2.545.000 | 10.000 | – | – | $275,88 | |
 TEMTempus Ai Inc | 0,01% | $1.158.600 | 20.000 | – | SOLD Q1 · 2026-81,8% · 90 Tsd. Stk. | $76,05 | |
 INODInnodata Inc | 0,00% | $755.800 | 10.000 | – | – | $37,03 | |
 CRWDCrowdstrike Hldgs Inc Ausgestiegen | - | - | 0 | SOLD Q2 · 2026-100% · 10 Tsd. Stk. | ← | $216,90 | |
 TSMTaiwan Semiconductor Mfg Ltd Ausgestiegen | - | - | 0 | SOLD Q2 · 2026-100% · 151 Tsd. Stk. | ← | $375,44 |