Frühlingsrabtatt -> 10% Rabatt! Code: "SPRING"
Howard Marks

Howard Marks Portfolio: Das Oaktree Capital Management Depot im Überblick
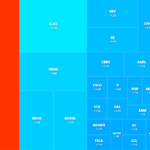
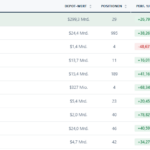
Laut dem letzten 13F-Filing (Stand 30.06.2026) umfasst das Oaktree Capital Management Depot von Howard Marks 138 Positionen mit einem Gesamtwert von $7,2 Mrd.
Wertentwicklung1 Jahr+54,51 %3 Jahre+142,49 %5 Jahre+329,01 %
Die größten Positionen im Oaktree Capital Management Depot sind Torm (TRMD, 7,3 %), Expand Energy (EXE, 6,6 %) und Garrett Motion (GTX, 3,8 %). Zusammen machen sie 17,7 % des Depots aus.
Was hat Howard Marks im 2. Quartal 2026 gekauft und verkauft?
Laut 13F-Meldung hat Howard Marks im 2. Quartal 2026 36 Positionen neu gekauft, 48 aufgestockt, 33 reduziert und 39 komplett verkauft.
Größte Käufe
- Oaktree Specialty LendingOCSLaufgestockt um 325,0 %≈ $72 Mio.
- SeaSEneu gekauft≈ $61 Mio.
- ViasatVSATneu gekauft≈ $57 Mio.
Größte Verkäufe
- Garrett MotionGTXreduziert um 48,0 %≈ $254 Mio.
- Petroleo Brasileiro S APBRkomplett verkauft≈ $126 Mio.
- SunoptaSTKLreduziert um 99,6 %≈ $113 Mio.
Prozentangaben: Veränderung der Stückzahl der jeweiligen Position gegenüber dem Vorquartal (kein Kursgewinn). Dollarwerte geschätzt mit dem Kurs zum Quartalsende. Sortiert nach Wert.

Howard Marks
Oaktree Capital Management, LP
Echtzeit-Einblicke & Depot-Analyse
Gesamtwert (USD) $7,2 Mrd.
Größte Position Torm Plc
Letztes Update Q2 2026
Gesamtrendite · 1 Jahr +54,51 %
Gesamtrendite · 3 Jahre +142,49 %
Gesamtrendite · 5 Jahre +329,01 %
138 Positionen
| Aktie | % Depot | Market Value $ | Shares | Q2 vs. Q1 2026 | Last Transaction | Kurs | |
|---|---|---|---|---|---|---|---|
 GPREGreen Plains Inc | 0,07% | $4.948.020 | 4.998.000 | – | SOLD Q1 · 2026-34,9% · 2,7 Mio. Stk. | $13,23 | |
 MSTRStrategy Inc | 0,07% | $4.711.299 | 5.451.000 | SOLD Q2 · 2026-54,9% · 6,6 Mio. Stk. | ← | $128,93 | |
N/A N/AFirstenergy Corp | 0,06% | $4.676.970 | 4.280.000 | NEW Q2 · 20264,3 Mio. Stk. | – | – | |
N/A N/ANorthern Oil & Gas Inc | 0,06% | $4.432.208 | 4.614.000 | BUY Q2 · 2026+130,7% · 2,6 Mio. Stk. | ← | – | |
N/A N/ARubrik Inc | 0,06% | $4.609.844 | 4.504.000 | NEW Q2 · 20264,5 Mio. Stk. | – | – | |
N/A BATLBattalion Oil Corp | 0,05% | $3.942.984 | 3.009.912 | – | SOLD Q4 · 2025-0,1% · 4 Tsd. Stk. | $0,75 | |
N/A DPCDpc Holdings Plc | 0,05% | $3.679.500 | 75.000 | NEW Q2 · 202675 Tsd. Stk. | – | $28,78 | |
 RIVNRivian Automotive Inc | 0,05% | $3.630.263 | 3.400.000 | BUY Q2 · 2026+161,5% · 2,1 Mio. Stk. | ← | $13,61 | |
N/A N/AService Pptys Tr | 0,05% | $3.360.365 | 1.988.382 | NEW Q2 · 20262,0 Mio. Stk. | – | – | |
 TMDXTransmedics Group Inc | 0,05% | $3.396.978 | 3.131.000 | NEW Q2 · 20263,1 Mio. Stk. | ← | $88,24 | |
N/A N/AWec Energy Group Inc | 0,05% | $3.340.149 | 3.214.000 | NEW Q2 · 20263,2 Mio. Stk. | – | – | |
N/A N/AZiff Davis Inc | 0,05% | $3.496.809 | 3.496.000 | – | BUY Q4 · 2025+158,8% · 2,1 Mio. Stk. | – | |
 AKAMAkamai Technologies Inc | 0,04% | $3.135.721 | 2.631.000 | SOLD Q2 · 2026-51,3% · 2,8 Mio. Stk. | ← | $83,09 | |
N/A NCLINcl Corp Ltd | 0,04% | $2.849.571 | 2.874.000 | NEW Q2 · 20262,9 Mio. Stk. | ← | – | |
N/A N/ABioxcel Therapeutics Inc | 0,03% | $1.946.150 | 1.380.248 | BUY Q2 · 2026+472,3% · 1,1 Mio. Stk. | ← | – | |
N/A N/ADatadog Inc | 0,03% | $1.993.600 | 1.400.000 | SOLD Q2 · 2026-81,8% · 6,3 Mio. Stk. | ← | – | |
N/A N/AHaemonetics Corp | 0,03% | $2.123.022 | 2.090.000 | BUY Q2 · 2026+149,7% · 1,3 Mio. Stk. | ← | – | |
 LYVLive Nation Entertainment In | 0,03% | $2.168.348 | 1.813.000 | – | SOLD Q1 · 2026-81,3% · 7,9 Mio. Stk. | $175,25 | |
N/A MGPIMgp Ingredients Inc | 0,03% | $2.450.559 | 2.515.000 | SOLD Q2 · 2026-59,8% · 3,7 Mio. Stk. | ← | $17,75 | |
 NNBRNn Inc | 0,03% | $1.834.285 | 510.943 | NEW Q2 · 2026511 Tsd. Stk. | – | $2,75 | |
 NTNXNutanix Inc | 0,03% | $2.484.900 | 2.200.000 | SOLD Q2 · 2026-71,1% · 5,4 Mio. Stk. | ← | $58,37 | |
N/A UT8Uber Technologies Inc | 0,03% | $2.396.000 | 2.000.000 | – | BUY Q1 · 2026– · 2,0 Mio. Stk. | – | |
 CXCemex Sab De Cv | 0,02% | $1.200.000 | 100.000 | SOLD Q2 · 2026-96,4% · 2,7 Mio. Stk. | ← | $10,72 | |
 FLRFluor Corp | 0,02% | $1.686.299 | 1.271.000 | SOLD Q2 · 2026-7,3% · 100 Tsd. Stk. | ← | $46,48 | |
N/A N/AGroupon Inc | 0,02% | $1.657.882 | 1.677.000 | NEW Q2 · 20261,7 Mio. Stk. | – | – | |
 ONOn Semiconductor Corp | 0,02% | $1.509.375 | 1.250.000 | NEW Q2 · 20261,3 Mio. Stk. | ← | $63,31 | |
N/A N/ARevolution Medicines Inc | 0,02% | $1.442.773 | 1.150.000 | NEW Q2 · 20261,2 Mio. Stk. | – | – | |
 TEOTelecom Argentina Sa | 0,02% | $1.509.365 | 116.105 | SOLD Q2 · 2026-92,8% · 1,5 Mio. Stk. | ← | $9,97 | |
N/A BABAFAlibaba Group Holding Ltd | 0,01% | $885.750 | 750.000 | NEW Q2 · 2026750 Tsd. Stk. | ← | $12,15 | |
N/A ALVOAlvotech Sa | 0,01% | $361.553 | 97.982 | SOLD Q2 · 2026-59,2% · 142 Tsd. Stk. | ← | $4,86 | |
N/A ALVOAlvotech Sa | 0,01% | $1.073.333 | 4.666.667 | – | – | $4,86 | |
N/A N/AImmunocore Holdings Plc | 0,01% | $766.360 | 833.000 | – | – | – | |
 NEONeogenomics Inc | 0,01% | $979.683 | 1.045.000 | SOLD Q2 · 2026-81,3% · 4,5 Mio. Stk. | ← | $16,84 | |
N/A N/ARice Acquisition Corp 3 | 0,01% | $395.999 | 399.999 | – | – | – | |
 SNASnap Inc | 0,01% | $873.185 | 877.000 | SOLD Q2 · 2026-76,7% · 2,9 Mio. Stk. | ← | $367,22 | |
 STKLSunopta Inc | 0,01% | $406.498 | 74.314 | SOLD Q2 · 2026-99,6% · 20,7 Mio. Stk. | ← | – | |
N/A N/AOffice Properties Income Trust/Md | 0,00% | $184.467 | 10.851 | NEW Q2 · 202611 Tsd. Stk. | – | – | |
N/A S1AK34Shake Shack Inc | 0,00% | $252.112 | 270.000 | NEW Q2 · 2026270 Tsd. Stk. | ← | – | |
N/A OPTUAltice Usa Inc Ausgestiegen | - | - | 0 | SOLD Q2 · 2026-100% · 7,3 Mio. Stk. | ← | – | |
N/A N/AAmerican Wtr Cap Corp Ausgestiegen | - | - | 0 | SOLD Q2 · 2026-100% · 55,9 Mio. Stk. | ← | – | |
 BANDBandwidth Inc Ausgestiegen | - | - | 0 | SOLD Q2 · 2026-100% · 4,2 Mio. Stk. | ← | – | |
N/A SQ3Block Inc Ausgestiegen | - | - | 0 | SOLD Q2 · 2026-100% · 37,8 Mio. Stk. | ← | – | |
N/A CBLCbl & Assoc Pptys Inc Ausgestiegen | - | - | 0 | SOLD Q2 · 2026-100% · 2,2 Mio. Stk. | ← | – | |
N/A N/ACelcuity Inc Ausgestiegen | - | - | 0 | SOLD Q2 · 2026-100% · 600 Tsd. Stk. | ← | – | |
 CAKECheesecake Factory Inc Ausgestiegen | - | - | 0 | SOLD Q2 · 2026-100% · 2,2 Mio. Stk. | ← | $106,76 | |
N/A N/ACoinbase Global Inc Ausgestiegen | - | - | 0 | SOLD Q2 · 2026-100% · 2,4 Mio. Stk. | ← | – | |
N/A ZCOICoinbase Global Inc Ausgestiegen | - | - | 0 | SOLD Q2 · 2026-100% · 52,6 Mio. Stk. | ← | – | |
N/A N/ACracker Barrel Old Ctry Stor Ausgestiegen | - | - | 0 | SOLD Q2 · 2026-100% · 26,2 Mio. Stk. | ← | – | |
 CRDOCredo Technology Group Holdi Ausgestiegen | - | - | 0 | SOLD Q2 · 2026-100% · 539 Tsd. Stk. | ← | $120,51 | |
N/A N/ADigitalocean Hldgs Inc Ausgestiegen | - | - | 0 | SOLD Q2 · 2026-100% · 3,0 Mio. Stk. | ← | – |