Frühlingsrabtatt -> 10% Rabatt! Code: "SPRING"
Kahn Brothers Group

Kahn Brothers Group Portfolio: Aktien und Depot im Überblick
Laut dem letzten 13F-Filing (Stand 30.06.2026) umfasst das Depot von Kahn Brothers Group 47 Positionen mit einem Gesamtwert von $633 Mio.
Wertentwicklung1 Jahr+45,21 %3 Jahre+93,88 %5 Jahre+122,27 %
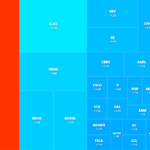
Die größten Positionen im Depot sind Citigroup (C, 18,5 %), Bayer Ag-Sponsored Adr (BAYRY, 14,1 %) und Flagstar Bank National Assoc (FLG, 9,6 %). Zusammen machen sie 42,2 % des Depots aus.
Was hat Kahn Brothers Group im 2. Quartal 2026 gekauft und verkauft?
Laut 13F-Meldung hat Kahn Brothers Group im 2. Quartal 2026 1 Position neu gekauft, 12 aufgestockt, 16 reduziert und 1 komplett verkauft.
Größte Käufe
- Zillow GroupZaufgestockt um 116,8 %≈ $20 Mio.
- MbiaMBIaufgestockt um 104,9 %≈ $14 Mio.
- Seaport Entmt GroupSEGaufgestockt um 2,7 %≈ $632.495
Größte Verkäufe
- OrganonOGNreduziert um 51,8 %≈ $39 Mio.
- Seaboard Corp DelSEBreduziert um 8,2 %≈ $2 Mio.
- Disney WaltDISreduziert um 5,2 %≈ $2 Mio.
Prozentangaben: Veränderung der Stückzahl der jeweiligen Position gegenüber dem Vorquartal (kein Kursgewinn). Dollarwerte geschätzt mit dem Kurs zum Quartalsende. Sortiert nach Wert.

Kahn Brothers Group
Echtzeit-Einblicke & Depot-Analyse
Gesamtwert (USD) $633 Mio.
Größte Position Citigroup Inc
Letztes Update Q2 2026
Gesamtrendite · 1 Jahr +45,21 %
Gesamtrendite · 3 Jahre +93,88 %
Gesamtrendite · 5 Jahre +122,27 %
47 Positionen
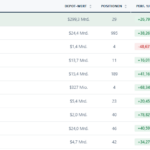
| Aktie | % Depot | Market Value $ | Shares | Q2 vs. Q1 2026 | Last Transaction | Kurs | |
|---|---|---|---|---|---|---|---|
 CCitigroup Inc | 18,50% | $117.053.726 | 836.337 | SOLD Q2 · 2026-0,5% · 5 Tsd. Stk. | ← | $119,05 | |
 BAYRYBayer Ag-Sponsored Adr | 14,12% | $89.307.717 | 6.518.603 | BUY Q2 · 2026+0,1% · 5 Tsd. Stk. | ← | $15,33 | |
N/A FLGFlagstar Bank National Assoc | 9,62% | $60.876.316 | 4.074.720 | SOLD Q2 · 2026-0,2% · 9 Tsd. Stk. | ← | $10,52 | |
 GOOGAlphabet Inc | 6,75% | $42.719.716 | 120.906 | SOLD Q2 · 2026-0,9% · 1 Tsd. Stk. | ← | $283,93 | |
 ZZillow Group Inc | 5,89% | $37.264.866 | 1.182.261 | BUY Q2 · 2026+116,8% · 637 Tsd. Stk. | ← | $29,55 | |
 OGNOrganon & Co | 5,72% | $36.158.881 | 2.670.523 | SOLD Q2 · 2026-51,8% · 2,9 Mio. Stk. | ← | $13,87 | |
 DISDisney Walt Co | 5,46% | $34.562.605 | 359.092 | SOLD Q2 · 2026-5,2% · 20 Tsd. Stk. | ← | $116,75 | |
 MRKMerck & Co. Inc | 4,43% | $28.036.427 | 218.182 | SOLD Q2 · 2026-4,0% · 9 Tsd. Stk. | ← | $146,73 | |
N/A MBIMbia Inc | 4,34% | $27.474.758 | 4.213.920 | BUY Q2 · 2026+104,9% · 2,2 Mio. Stk. | ← | $4,62 | |
N/A SEGSeaport Entmt Group Inc | 3,86% | $24.392.333 | 917.005 | BUY Q2 · 2026+2,7% · 24 Tsd. Stk. | ← | $20,79 | |
N/A SEBSeaboard Corp Del | 3,80% | $24.058.274 | 5.389 | SOLD Q2 · 2026-8,2% · 482 Stk. | ← | $3.528,16 | |
 BPBp Plc | 3,65% | $23.093.713 | 624.999 | BUY Q2 · 2026+0,4% · 3 Tsd. Stk. | ← | $44,53 | |
 IDTIdt Corp | 3,23% | $20.452.545 | 351.660 | SOLD Q2 · 2026-5,6% · 21 Tsd. Stk. | ← | $82,17 | |
 PTENPatterson-Uti Energy Inc | 2,41% | $15.273.298 | 1.663.758 | SOLD Q2 · 2026-1,6% · 26 Tsd. Stk. | ← | $9,92 | |
 PFEPfizer Inc | 1,77% | $11.173.144 | 464.001 | SOLD Q2 · 2026-4,3% · 21 Tsd. Stk. | ← | $29,39 | |
 BMYBristol-Myers Squibb Co | 1,59% | $10.034.638 | 174.152 | BUY Q2 · 2026+2,2% · 4 Tsd. Stk. | ← | $62,14 | |
 GSKGsk Plc | 1,31% | $8.305.319 | 158.438 | SOLD Q2 · 2026-1,6% · 3 Tsd. Stk. | ← | $50,33 | |
 XOMExxon Mobil Corp | 0,38% | $2.413.791 | 17.655 | SOLD Q2 · 2026-3,3% · 600 Stk. | ← | $165,87 | |
 GNEGenie Energy Ltd | 0,35% | $2.195.547 | 151.941 | SOLD Q2 · 2026-13,2% · 23 Tsd. Stk. | ← | $17,72 | |
 NVSNovartis Ag | 0,33% | $2.066.509 | 13.186 | SOLD Q2 · 2026-1,5% · 200 Stk. | ← | $162,55 | |
 CSXCsx Corp | 0,26% | $1.653.140 | 34.781 | SOLD Q2 · 2026-4,7% · 2 Tsd. Stk. | ← | $49,12 | |
N/A FRFHFFairfax Finl Hldgs Ltd | 0,26% | $1.673.994 | 1.018 | – | – | $1.895,55 | |
N/A FBAKFirst Natl Bk Alaska Com | 0,25% | $1.555.719 | 4.920 | – | SOLD Q4 · 2025-1,4% · 70 Stk. | $339,99 | |
N/A TRMLFTourmaline Oil Corp | 0,18% | $1.126.933 | 26.959 | – | BUY Q4 · 2025+10,4% · 3 Tsd. Stk. | $44,49 | |
 JPMJpmorgan Chase & Co | 0,15% | $942.055 | 2.878 | BUY Q2 · 2026+2,1% · 60 Stk. | ← | $334,49 | |
 AAPLApple Inc | 0,14% | $894.701 | 3.092 | – | BUY Q4 · 2025+3,3% · 100 Stk. | $342,37 | |
 MSFTMicrosoft Corp | 0,13% | $808.707 | 2.168 | BUY Q2 · 2026+3,6% · 76 Stk. | ← | $530,61 | |
 BACBank Of Amer Corp | 0,09% | $538.973 | 9.459 | – | SOLD Q1 · 2026-9,8% · 1 Tsd. Stk. | $49,42 | |
 HLNHaleon Plc | 0,09% | $544.321 | 58.341 | BUY Q2 · 2026+3,4% · 2 Tsd. Stk. | ← | $9,14 | |
N/A SEICSei Invts Co | 0,09% | $578.535 | 6.596 | – | BUY Q1 · 2025+28,2% · 1 Tsd. Stk. | $105,30 | |
N/A PEYUFPeyto Expl & Dev Corp | 0,08% | $522.150 | 31.307 | – | SOLD Q1 · 2026-1,7% · 550 Stk. | $17,00 | |
 RFLRafael Hldgs Inc | 0,08% | $493.617 | 150.493 | BUY Q2 · 2026+157,0% · 92 Tsd. Stk. | ← | $1,04 | |
N/A WRLCWindrock Ltd Co | 0,07% | $443.841 | 807 | BUY Q2 · 2026+50,3% · 270 Stk. | ← | $545,00 | |
 CVXChevron Corporation | 0,05% | $323.729 | 1.953 | – | SOLD Q1 · 2026-2,5% · 50 Stk. | $212,61 | |
 DBDeutsche Bank A G | 0,05% | $337.600 | 10.000 | – | BUY Q3 · 2024– · 10 Tsd. Stk. | $34,84 | |
 IBMInternational Business Machs | 0,05% | $345.325 | 1.228 | – | SOLD Q4 · 2025-18,6% · 280 Stk. | $245,00 | |
N/A OBTOrange Cnty Bancorp Inc | 0,05% | $294.240 | 8.000 | – | BUY Q2 · 2025– · 8 Tsd. Stk. | $39,50 | |
 PNCPnc Finl Svcs Group Inc | 0,05% | $330.427 | 1.342 | – | SOLD Q1 · 2026-40,5% · 915 Stk. | $225,38 | |
 PEGPublic Svc Enterprise Group | 0,05% | $286.007 | 3.524 | – | SOLD Q1 · 2026-20,3% · 900 Stk. | $72,61 | |
N/A WEDWebster Finl Corp | 0,05% | $332.350 | 4.349 | NEW Q2 · 20264 Tsd. Stk. | ← | – | |
 AMAntero Midstream Corp | 0,04% | $268.586 | 11.806 | – | SOLD Q1 · 2026-37,4% · 7 Tsd. Stk. | $18,98 | |
 BXBlackstone Inc | 0,04% | $270.641 | 2.300 | – | BUY Q4 · 2025+53,3% · 800 Stk. | $119,50 | |
 PEPPepsico Inc | 0,04% | $243.720 | 1.800 | – | SOLD Q4 · 2024-5,3% · 100 Stk. | $141,34 | |
 PGProcter & Gamble Co | 0,04% | $256.913 | 1.752 | SOLD Q2 · 2026-5,4% · 100 Stk. | ← | $165,40 | |
 VZVerizon Communications Inc | 0,04% | $240.575 | 5.682 | – | SOLD Q1 · 2026-30,3% · 2 Tsd. Stk. | $45,69 | |
 ZDGEZedge Inc | 0,04% | $242.190 | 78.126 | BUY Q2 · 2026+0,3% · 198 Stk. | ← | $2,24 | |
N/A PIFYFPine Cliff Energy Ltd Com | 0,03% | $208.938 | 520.000 | – | SOLD Q3 · 2025-1,9% · 10 Tsd. Stk. | $0,38 | |
N/A N/ATphgreenwich Trust Uni | 0,00% | $0 | 166.999 | – | – | – | |
 CMCSAComcast Corp New Ausgestiegen | - | - | 0 | SOLD Q2 · 2026-100% · 7 Tsd. Stk. | ← | $24,39 |